Increase Exploration Success and Efficiency. You have large amounts of under-explored data sitting around in your database? Mine it - it may lead to your next discovery! Introducing our Data Analytics Group lead by Dr. Conny Kitzig.
We can help you get the most out of your data by tailoring and applying machine learning and data mining techniques to your particular problem, for example:
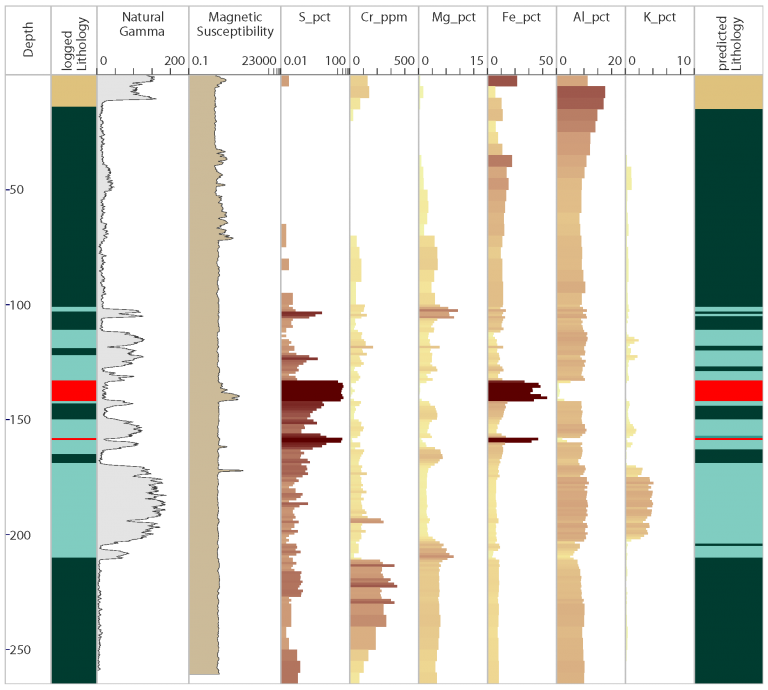
- Validate geological logging against predicted lithology or a data driven classification;
- Quickly identify rock mass features like faults and fractures from petrophysical downhole data;
- Find unknown patterns in your data that may indicate alteration haloes or vectors towards the next target;
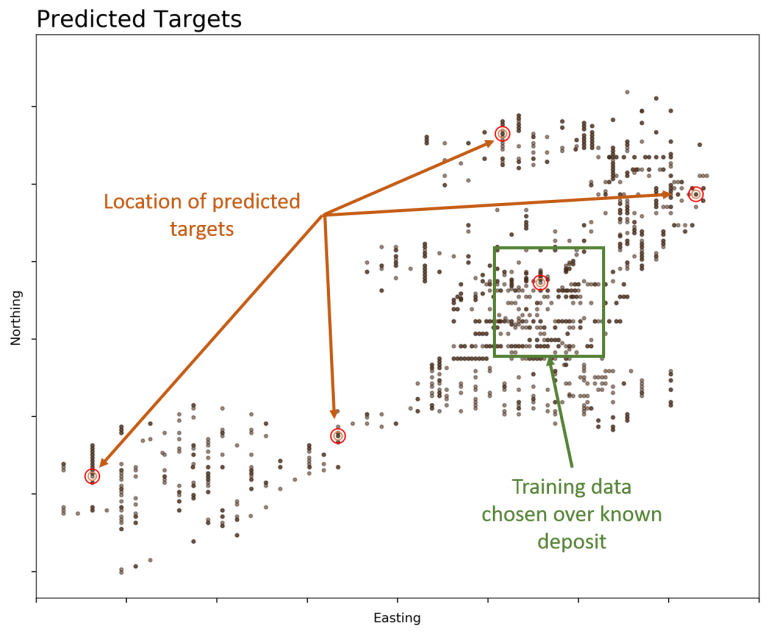
- Utilise multivariate data collected from a known deposit to generate prospective drill targets;
- Gain deeper insights and understanding of your deposit style.
Machine learning for lithology prediction
Predicting intersected lithology from assay or petrophysical log data is merely one of the many possibilities that machine learning can bring to the exploration and mining world. Sophisticated algorithms are plentiful and easily adapted to specific problems as they arise.
The main advantage of machine learning algorithms is their ability to deal with multidimensional data in a way that the human brain can’t. Trying to evaluate a multitude of assay variables simultaneously to validate geological logging will quickly cause headaches even for the most capable multitasker. Thus, applying a carefully trained algorithm to carry out the task can speed up the process considerably and provide a more objective evaluation of the data compared to manual processing.
Apart from lithology prediction itself, models can be built to predict other rock mass characteristics of interest if the appropriate data exists. For example, an important measure of the degree of fracturing and jointing of a rock (RQD) may be predicted from a combination of petrophysical data such as rock hardness, sonic velocity or electrical properties.
Deep learning for target generation
Deep learning algorithms such as multi-layered artificial neural networks can be utilised to solve complex problems or where the relationship between the input variables and the output (target) is more obscure. In supervised learning, the neural network model is trained against a known target whereas unsupervised models are used for pattern recognition, anomaly detection or automatic feature extraction.
Large amounts of data from different sources can be analysed at once and the results may highlight ore bodies, identify alteration haloes or fault systems as well as map out bedrock and regolith types.
In the current mineral exploration practice only a fraction of the collected data is used to inform decisions and the utilised data is interpreted subjectively by geophysicists and geologists. Imagine the advantages of supplementing this process with data driven methods to generate objective solutions – and utilising all your costly data at the same time.
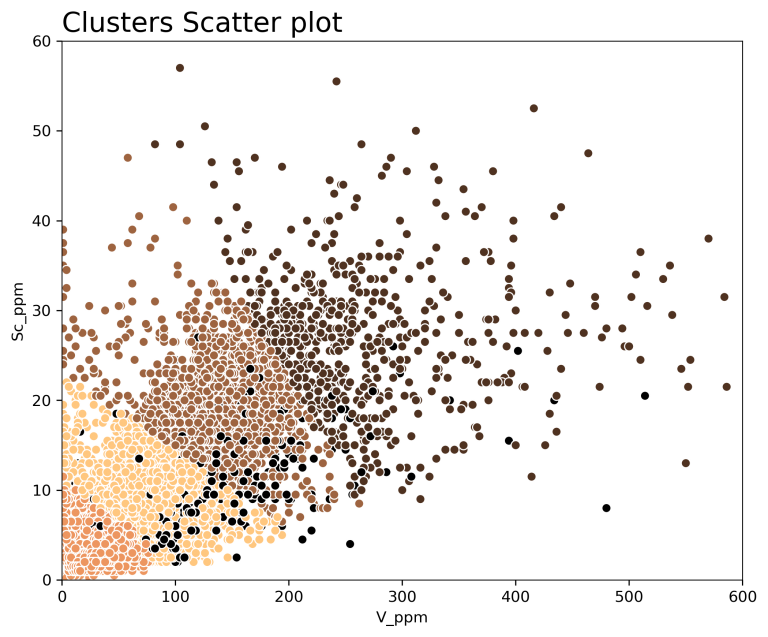
Cluster analysis for rock mass classification
Data clustering can result in a cleaner, more objective and often simplified classification compared to core or chip logging, and reduce or eliminate discrepancies in logging between geologists and through time. Drillsection or mapping interpretations can be enhanced by basing correlations on objectively derived rock mass classification, giving a more robust basis for interpretation.
Depending on the classification objective, e.g. litho-type, alteration style, rock quality etc., the input variables and algorithm parameters need to be carefully selected.
Cluster algorithm performance can decrease when too many or too few variables are chosen and the results may be meaningless if the input variables don’t carry the necessary information for the desired classification.
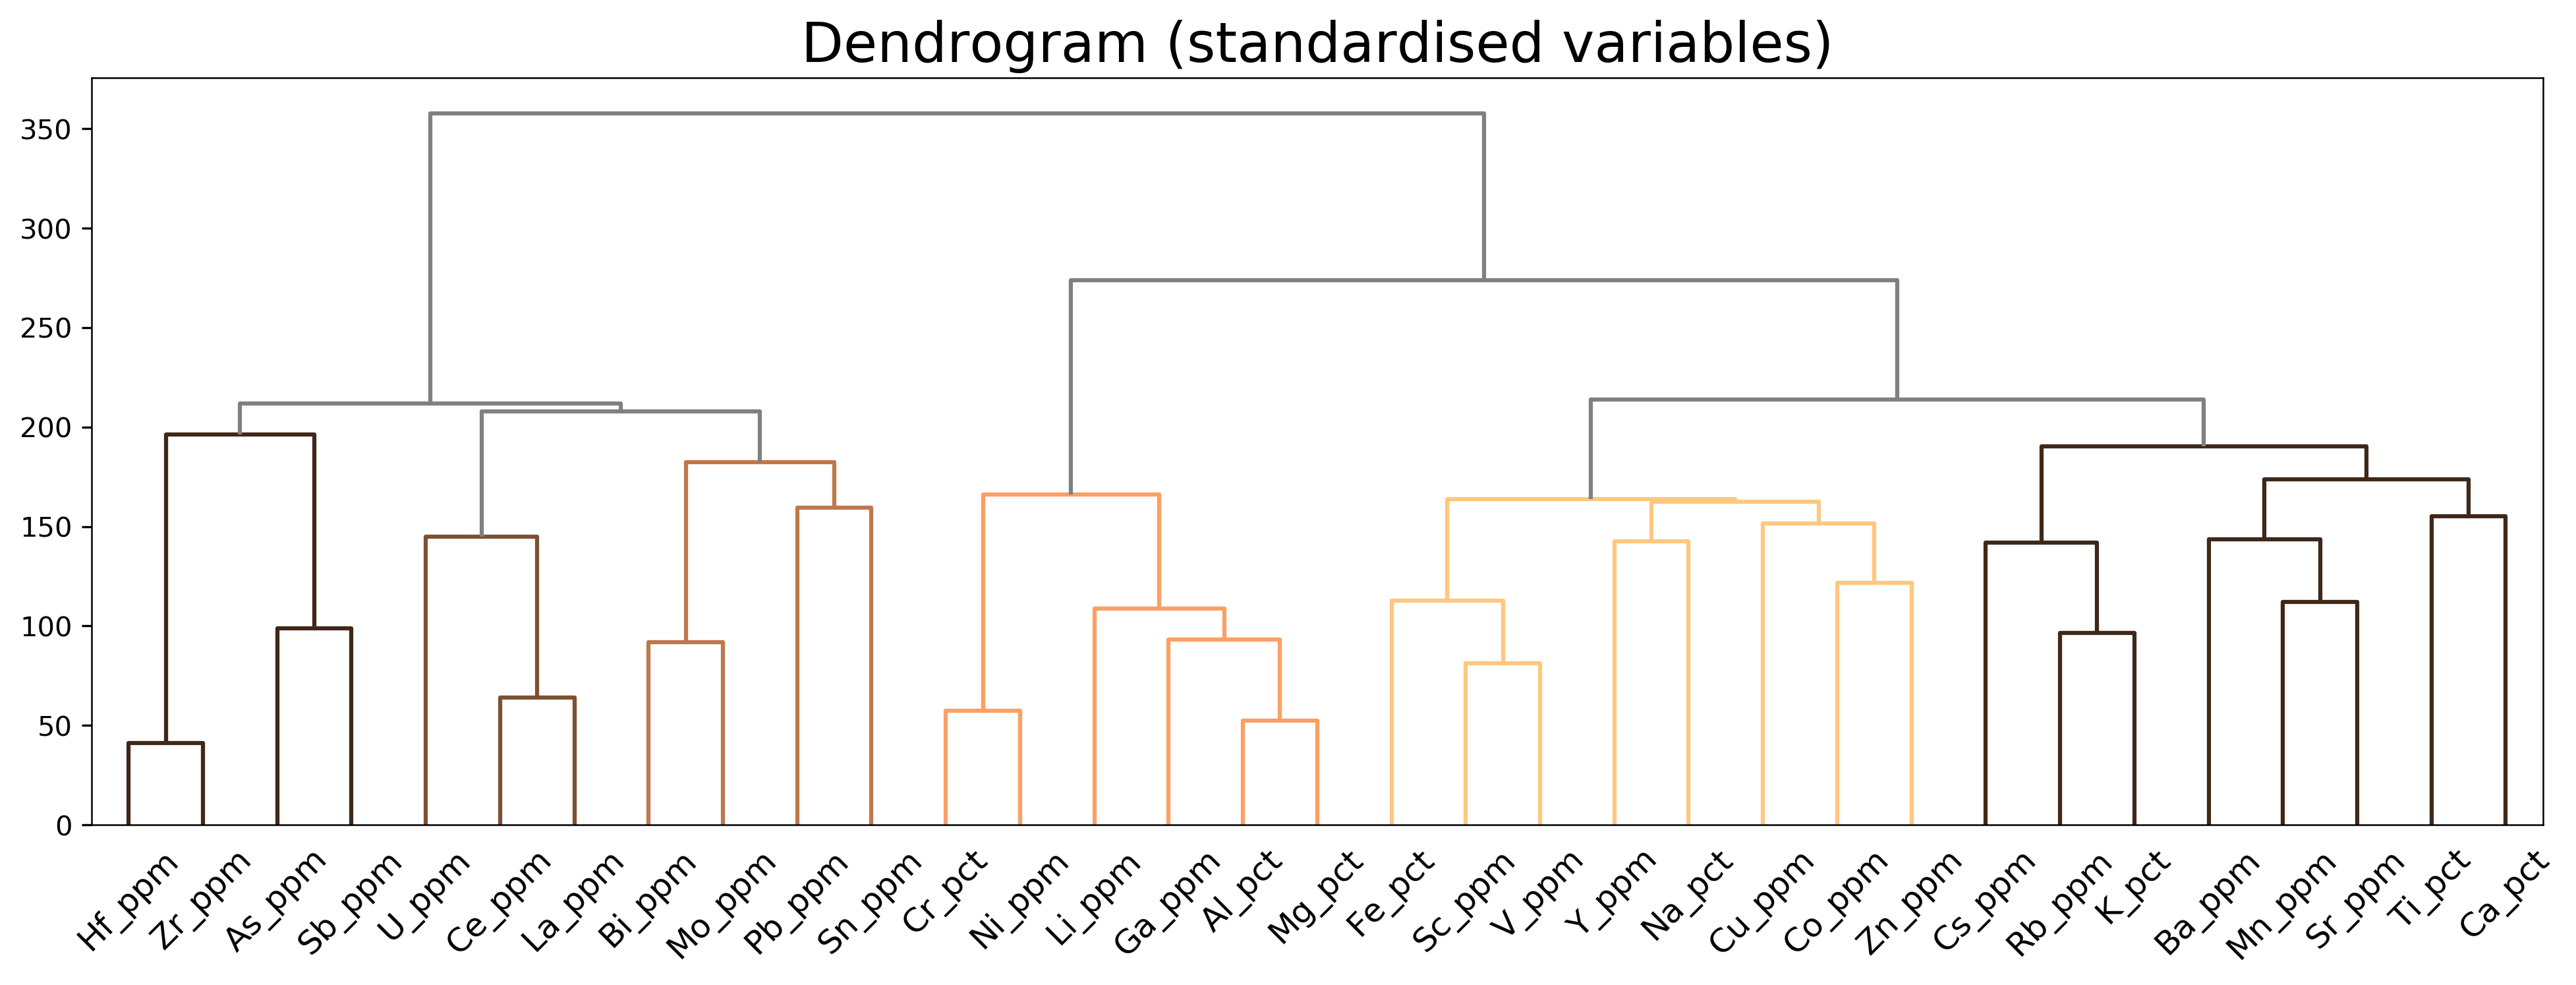
Data mining basics – pre-processing, statistical analysis and visualisation
Understanding the statistical properties and relationships of the data variables is an important first step of any data analytical workflow. Visualisations help to quickly identify data distributions and characteristics and make the right choices in regard to selecting input variables and algorithm parameters for cluster analysis and feature prediction. For example, knowing the mode (how many peaks) a distribution has can help with cluster centroid initialisation, a high degree of skew in the data may prompt a data transform to be applied before analysis.


Publications
Published research from our team can be found via these links:
Testing cluster analysis on combined petrophysical and geochemical data for rock mass classification